Presence Analytics is an advanced feature of our Wi-Fi Pro service that enables businesses to collect real-time data on user footprints within the wireless network range of Aruba Instant APs that are managed using Aruba Central.
How to enable Presence Analytics
1. Access the Aruba Central portal and launch the app.
2. In the Aruba Central app, set the view filter to Global, not the devices group.
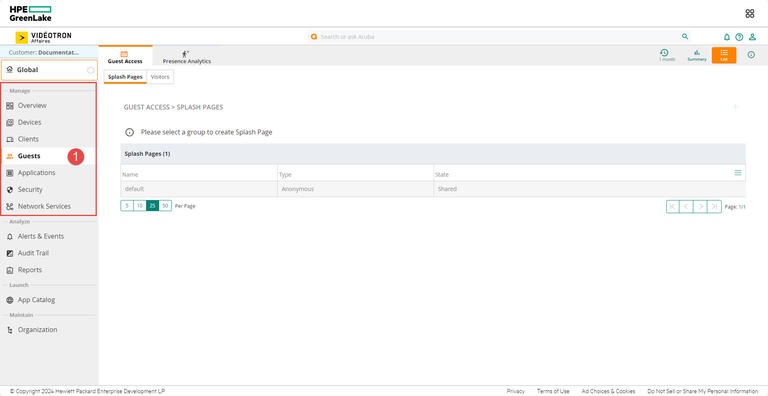
3. In the left section under Manage select Guests.
4. Select the Presence Analytics tab and click on the Config button represented by a sprocket in order to change the parameters.
5. Turn on the Enable all Access Points toggle switch to collect data for sites analytics.
How do I adjust attendance thresholds?
Once you have enabled access points, you can start collecting data for site analysis. Presence Analysis displays data for all sites or by site.
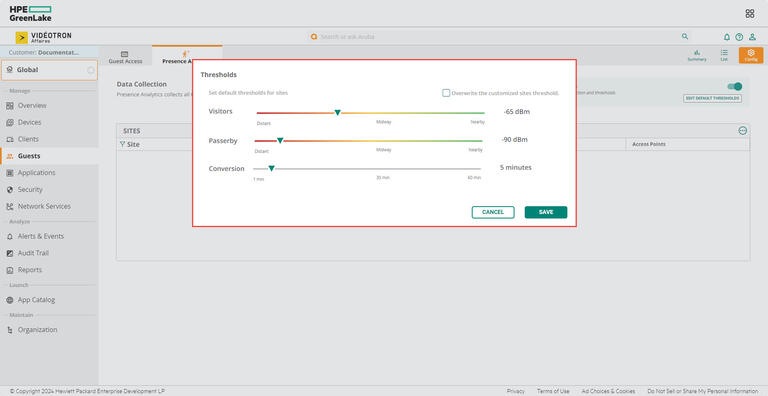
1. From the configuration page (see previous section), click on the Change Default Thresholds button.
2. Adjust the desired thresholds
Passerby: An associated or unassociated client who is in the vicinity of a specific site. Refers to any device that enters the extended radius of the Wi-Fi network without necessarily connecting to the corporate network.
Visitors: Based on the engagement pattern and the time spent by the clients at the site. Refers to any device that enters the close radius of the Wi-Fi network or remains connected for a set amount of time within the radius of the Wi-Fi network.
dBm (decibel-milliwatt): Wi-Fi signal strength level from -100 dBm (remote) to 0 dBm (near).
Conversion : Allows you to convert Passerby into Visitors when their visit exceeds a certain period of time. You can adjust the conversion threshold yourself based on your estimate of the average length of your customers' visits. By default, the visit time is set to 5 minutes.
3. Save
Good to know
How to use Presence Analytics?
The Presence Analytics page displays the following menu options:
- List : Displays a list view of site analytics for all the sites in the account, or the selected site.
- Summary : Displays the graphical view of the Passerby metrics, the Loyal Visitors, Visit Frequency, and the Visit Status.
- Configuration : Allows you to enable data collection from access points.
1. On the Presence Analytics page, click on the Summary button at the top right.
The Summary view provides a statistical analysis of the Passerby, Visitors, Visit Frequency, and Visit Status in a graphical representation. The graph can be populated for the following time range:
Hourly: Data for the hour, with the current time taken as the basis for calculation.
Daily: Data for the hour, with the current time taken as the basis for calculation.
Weekly: Data for the last previous week, with 00:00 hour of the current week taken as the basis for calculation.
Select the specific time period from the time range filter. Hourly and Daily data is populated if the filter is set between 24 hours and 48 hours. Daily and Weekly data is displayed if the filter is set between 2 days and 1 month.

2. On the Presence Analytics page, click on the List button at the top right.
The Site Analytics table lists the data for all sites connected to the network. By default, the Site Analytics table displays the following columns: Site, Unique Passerby, Unique Visitor, Draw Rate, Visit, Loyal Visitor, Average Dwell Time, and Connected Visit.
Time range filter: You can view the clients' presence data for a selected time range. Click the time range filter and select the From and To date. Click Apply. The table displays the analytics data for the selected time range.
Site: Displays the name of the site or sites in the network.
Unique Passerby: Displays the aggregate count of unique passers-by for the selected time range.
Unique Visitor: Displays the aggregate count of unique visitors for the selected time range.
Draw Rate: Displays the percentage of passerby converted to visitors for the selected time range.
Visit: Displays the total number of visits made by clients for the selected time range. This includes repeat visits made by a particular client.
Loyal Visitor: Displays the aggregate count of the visitors categorized as loyal. Visitors who have visited a site more than once in the previous month are referred to as loyal visitors.
Average Dwell Time: Displays the average time spent by visitors at a site for the selected time range.
Connected Visits: Displays the total number of visits connected to the Aruba SSID for the selected time range.
3. You can select custom date ranges for both view types (Summary and List) by clicking on the dates displayed on your screen.

Creation of Presence Analytics reports
Several types of reports can be generated at various intervals, in PDF or . CSV, and sent automatically by email.
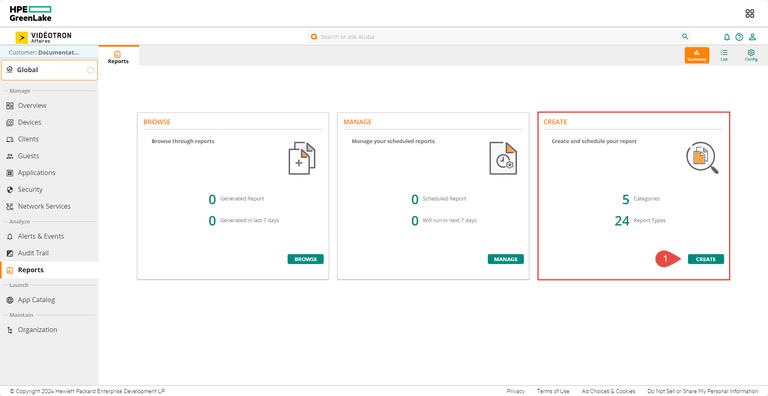
1. In the Analyze section on the left, select Reports.
2. Click the Create button to generate a new report.
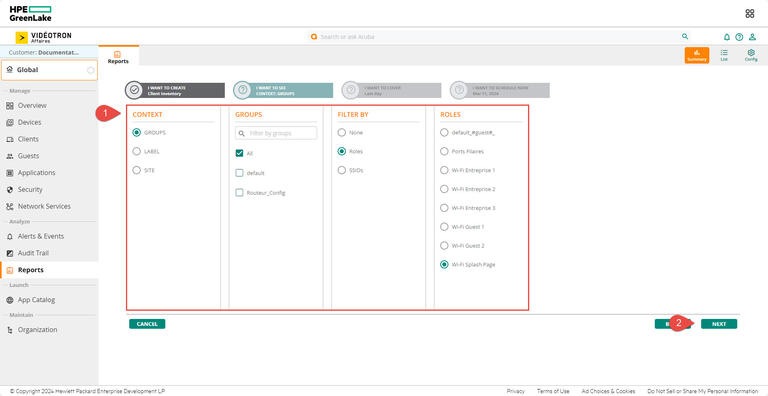
3. Choose the type of report you want from the categories provided, then click Next.

4. Choose the desired content in the report, then click Next.
5. Choose the desired time period in the report, then click Next.
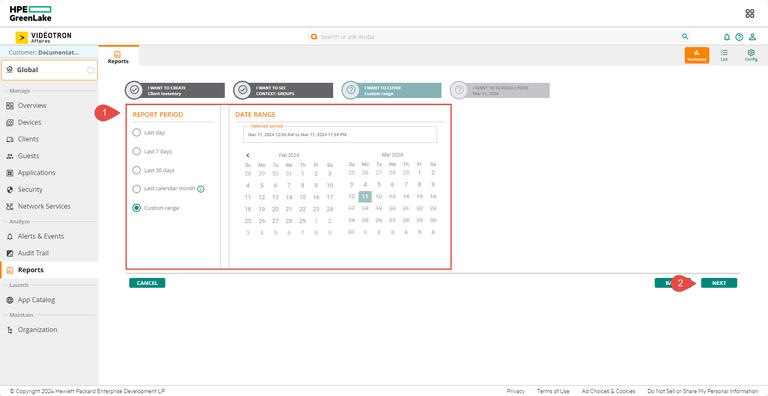
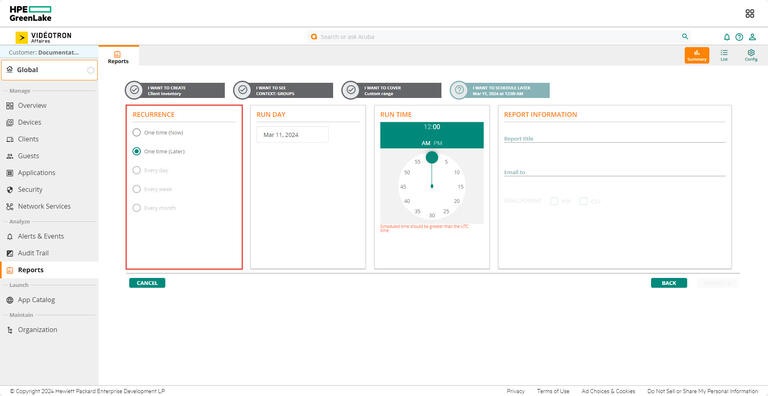
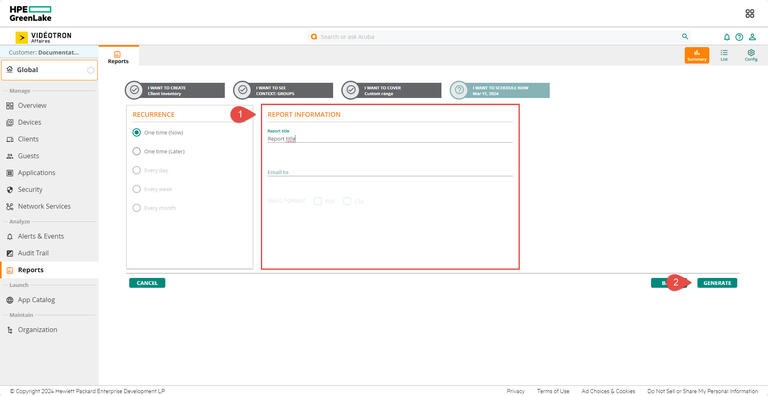
6. Choose the recurrence of the report and click Generate to get your report. You can schedule reports by day and by hour.
7. Name the report, add a destination email address, and choose the format you want. Then click Generate to get the report.
More support
Still need help?

Customer Service
For any questions about your account or invoice, or to modify or add services.

